-
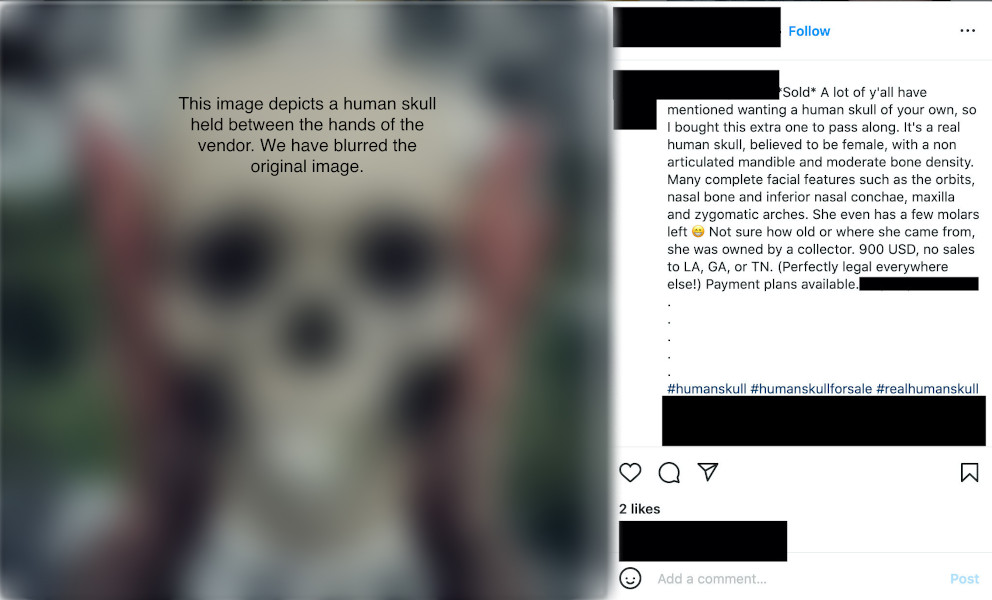
Figure 1.1. Screenshot of a vendor's post on Instagram. Note the framing of the language of the post. Source: Instagram.
-
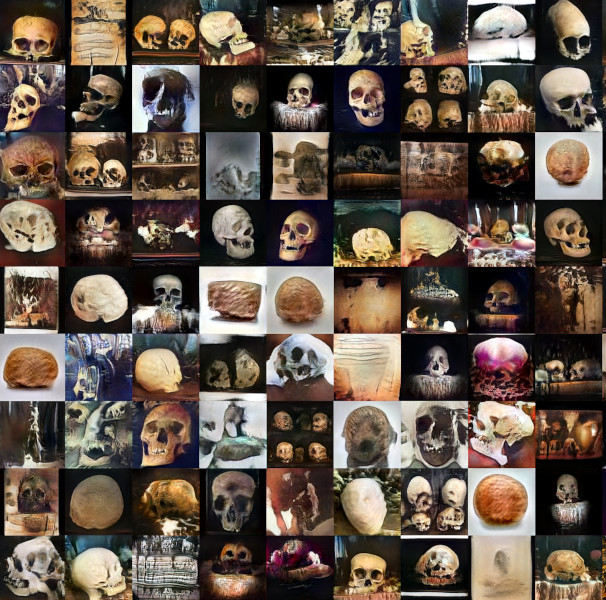
Figure 1.2. Imaginary skulls generated by Deep Convolutional Generative Adversarial Networks, trained on 1,500 images collected from Instagram. Originally published in Huffer, Wood, and Graham 2019, figure 3, CC-BY 3.0.
-
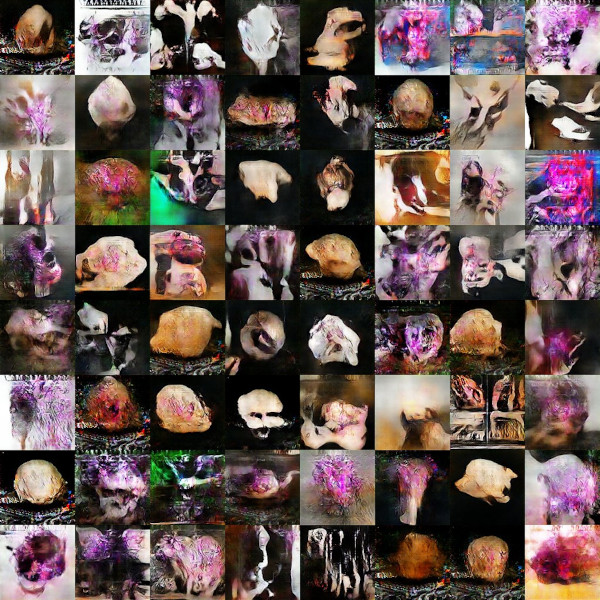
Figure 1.3. Imaginary skulls for sale, generated by Deep Convolutional Generative Adversarial Networks trained on 6,700 images collected from Instagram. Originally published in Huffer, Wood, and Graham 2019, figure 4, CC-BY 3.0.
-
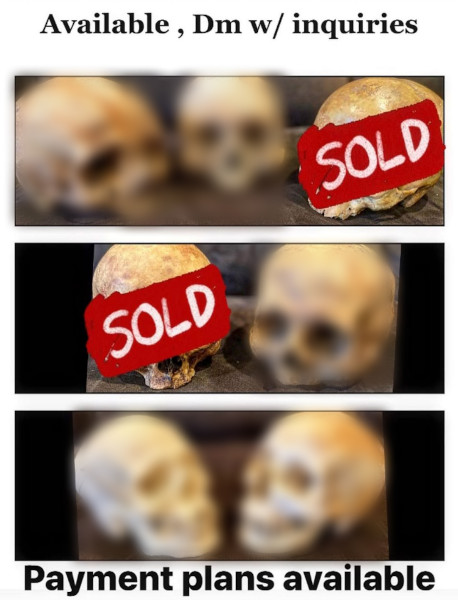
Figure 1.4. Figure 1.4. A detail from one Instagram photo where there is no mention of price in the text of the associated post. Instead, the word “sold” is digitally overlaid on certain skulls, and the heading inviting the viewer to send a direct message is added to the image itself; embedded text like this cannot normally be scraped or detected. Source: Instagram.
-
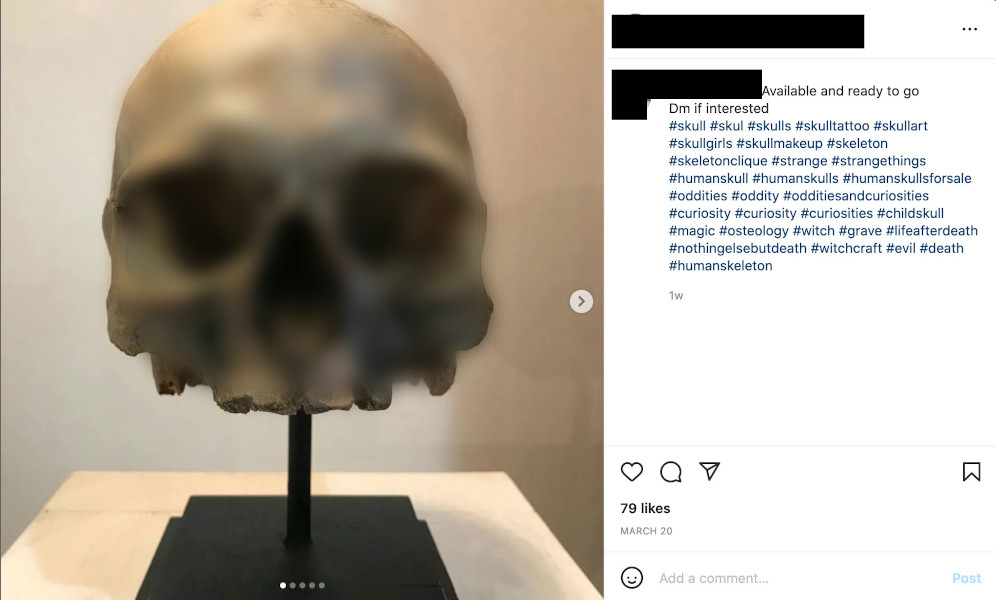
Figure 1.5. A simple post offering a skull for sale. Source: Instagram.
-
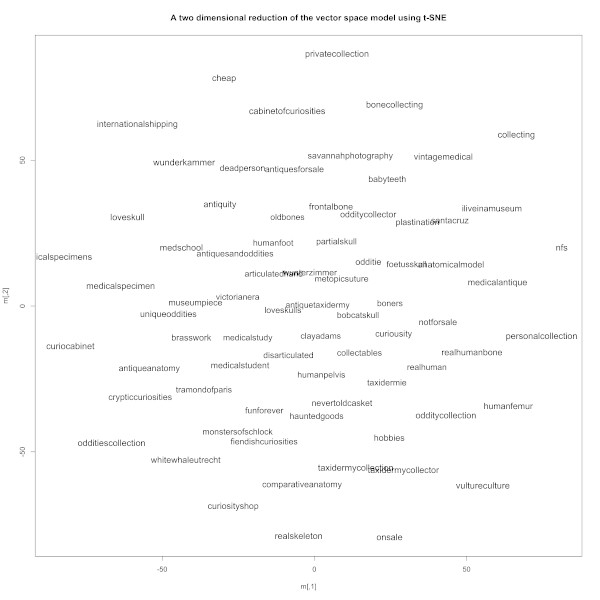
Figure 2.1. t-SNE graph of the word vector space “forsale-notforsale.” Originally published in Huffer and Graham 2017, figure 2, CC-BY 3.0.
-
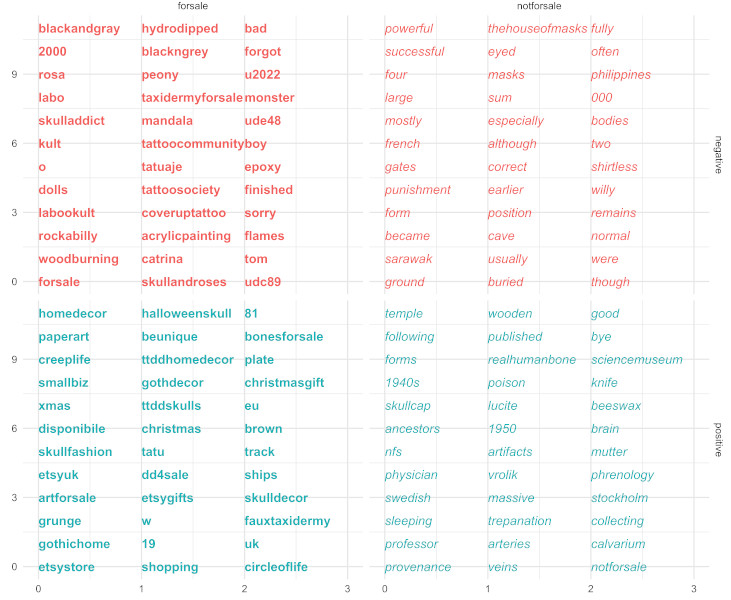
Figure 2.2. Exploring the vector space defined by binary pairs, “good”/”bad,” “for sale”/”not for sale.” Hints of various dynamics at play can be viewed in contrasting, but related, terms, e.g., as with “acrylic painting” falling in negative space and “skull decor” falling in positive space. This might be a glimpse into the taste or aesthetic of those who create skull-related art, which may be important for understanding what creates the taste and demand for human remains themselves. Originally published in Huffer and Graham 2017, figure 3, CC-BY 3.0.
-
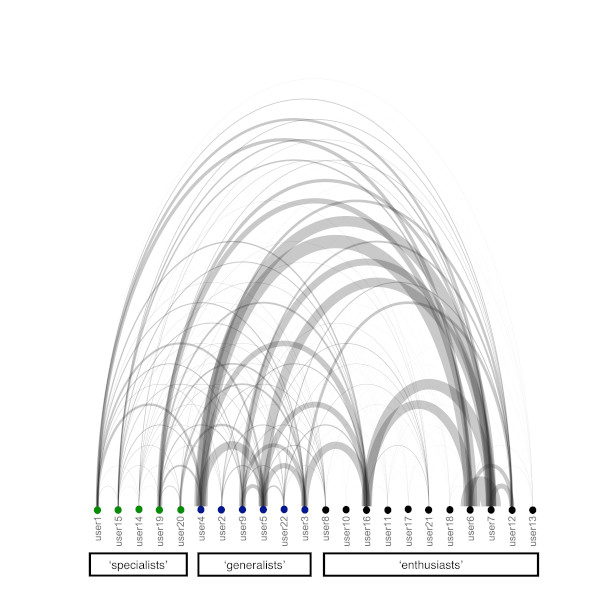
Figure 2.3. An initial network visualization of the structure of these communities. Originally published in Huffer and Graham 2017, figure 6, CC-BY 3.0.
-
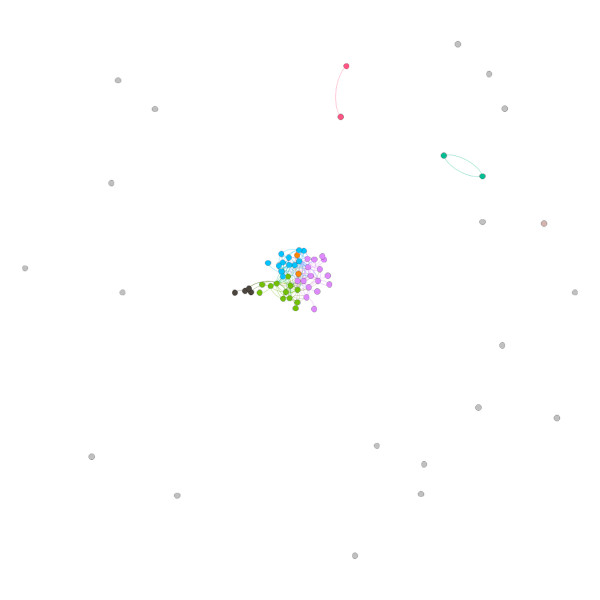
Figure 2.4. Social network visualization of the filtered network of seventy accounts that named a price in posts made in 2020. The unfiltered network consists of 235,593 accounts connected by 257,676 “follower” relationships at one step. Color is assigned through community detection (nodes that have similar patterns of relationships are assigned to the same cluster and colored accordingly). There is a central “core” group of vendors who are connected together, while there is a large penumbra of “one off” accounts that from this perspective have nothing to do with each other. Originally published in Graham and Huffer 2020, figure 1, CC-BY 3.0.
-
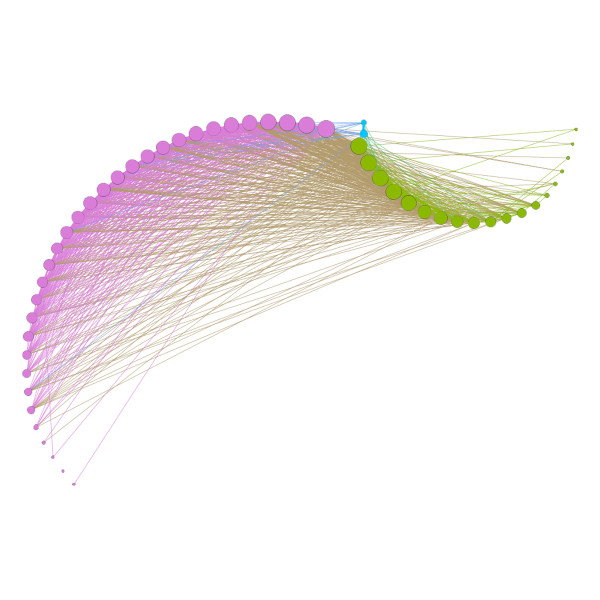
Figure 2.5. Social network visualization of the same data (235,593 accounts connected by 257,676 edges) recast so that the seventy vendors are connected to each other by virtue of having followers in common. (A person who follows vendor A and also follows vendor B is turned into an edge or tie between A and B. Each edge thus has a “weight” that represents the number of followers in common.) A vendor might not follow another but be connected by having followers in common: thus, for those followers the two vendors’ posts help create a culture of consumption around images of human remains (which may or may not lead to purchases). Community detection is run again, taking edge weight into account. The result is three distinct groups. Originally published in Graham and Huffer 2020, figure 2, CC-BY 3.0.
-
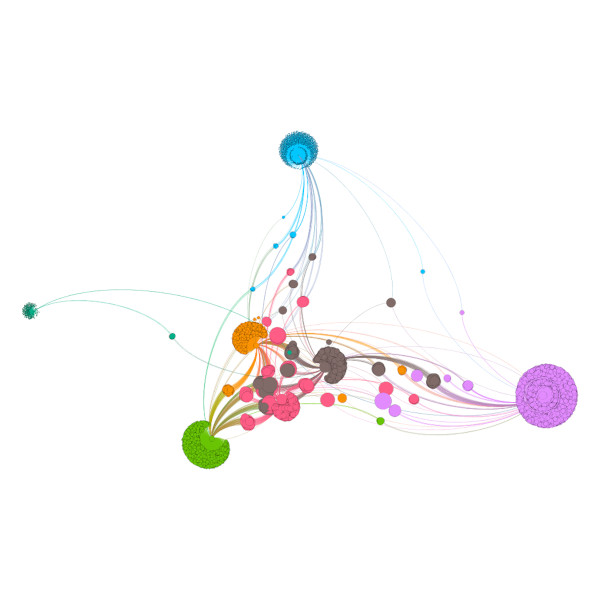
Figure 2.6. A social network generated by focusing on the followed accounts in common for eight bone trading accounts. Accounts that only one vendor follows arrange like a dandelion head, while accounts that are followed by more than one vendor act as bridges between the clusters. The network is colored by community detection. Created by Huffer and Graham, CC-BY 4.0.
-
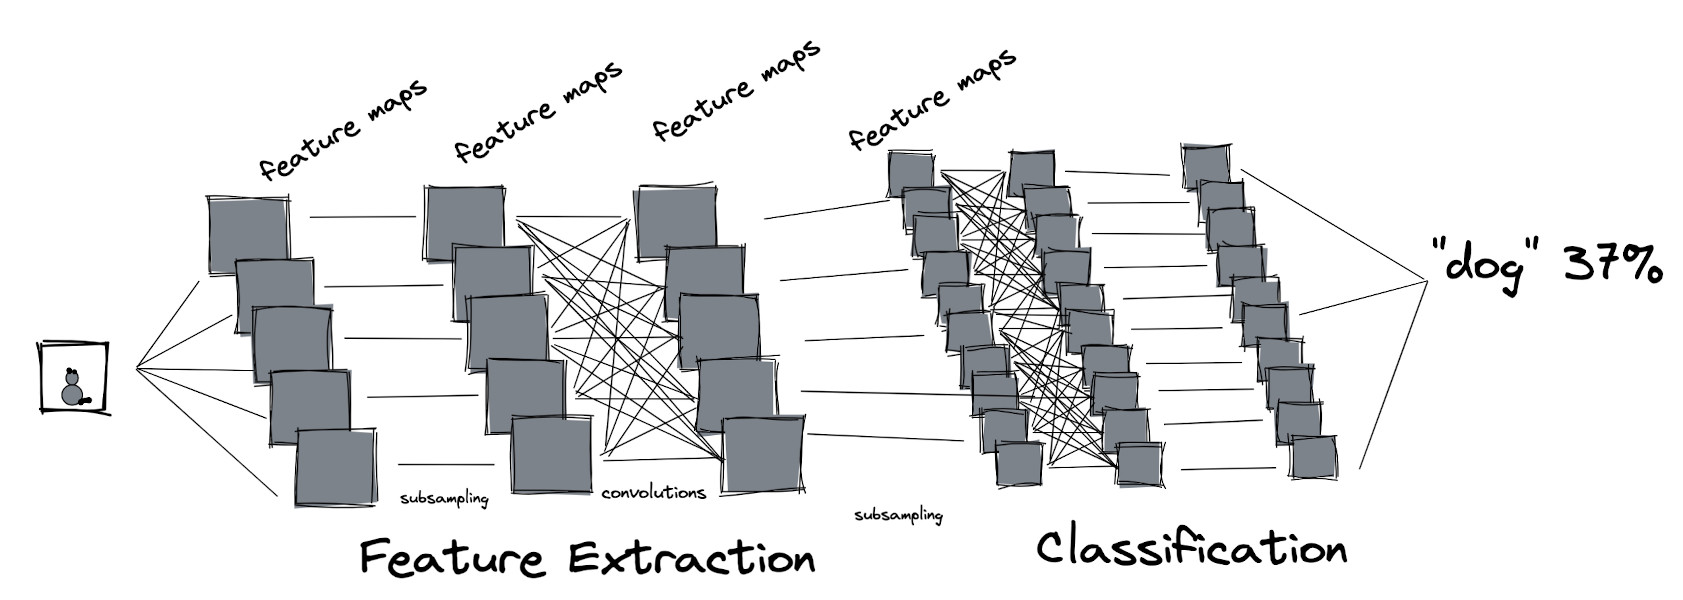
Figure 3.1. A greatly simplified representation of a convolutional neural network. The network is exposed to an image; a convolution acts as a filter or “kernel” passing over the image to identify features; these are passed progressively to the next layers according to the weights of the connections, to identify more and more complex features. The final layers assign the classification. Created by Huffer and Graham, CC-BY 4.0.
-

Figure 3.2. t-SNE projection of image vectors of data collected for Huffer and Graham 2017. Originally published in Huffer and Graham 2018, figure 1, CC-BY 4.0.
-
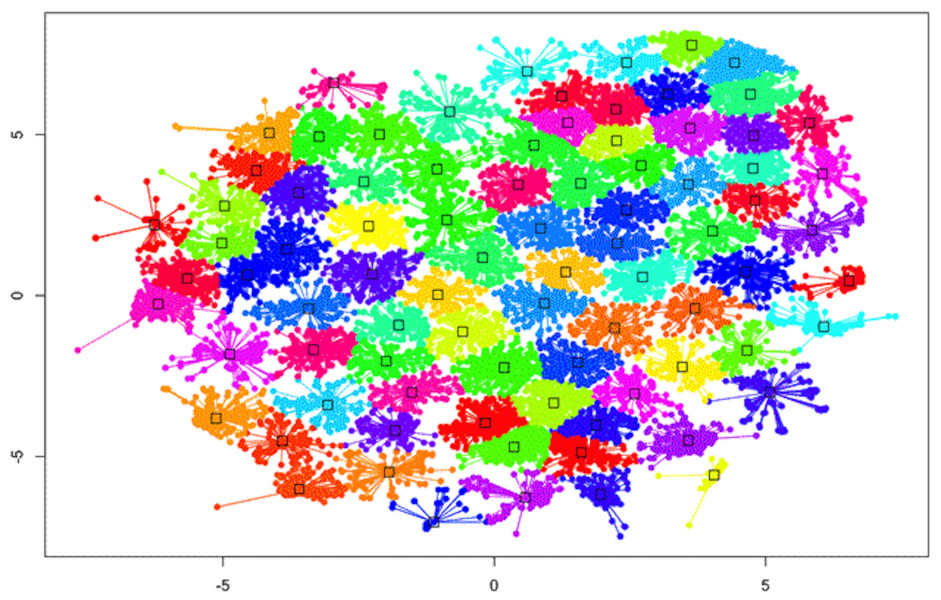
Figure 3.3. t-SNE projection of image vectors of data collected where the eighty-four clusters determined by affinity propagation are indicated by shading. Squares indicate the location of the exemplar datapoint for a given cluster. Originally published in Huffer and Graham 2018, figure 2, CC-BY 4.0.
-
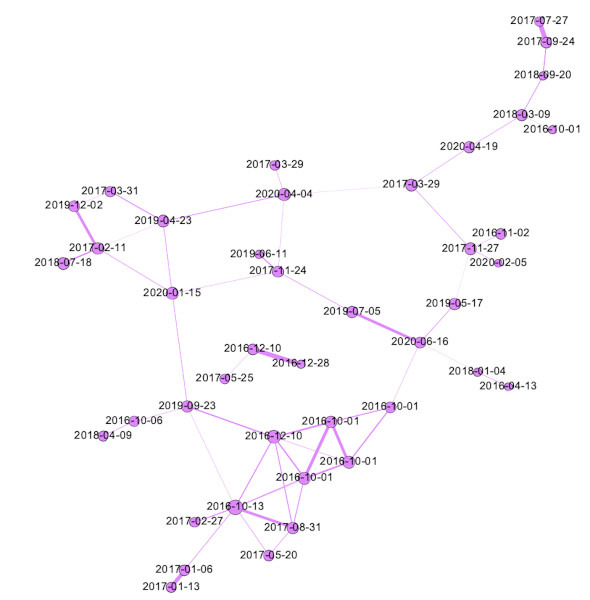
Figure 3.4. The largest “community” or module from a network of visual similarity, filtered to only show strongest similarities (> 85 percent). Darker lines denote closer visual similarity. Individual nodes are labeled with the date on which they were posted. Figure regenerated from the same data discussed in Davidson, Graham, and Huffer 2021, figure 2. Created by Huffer and Graham, CC-BY 4.0.
-
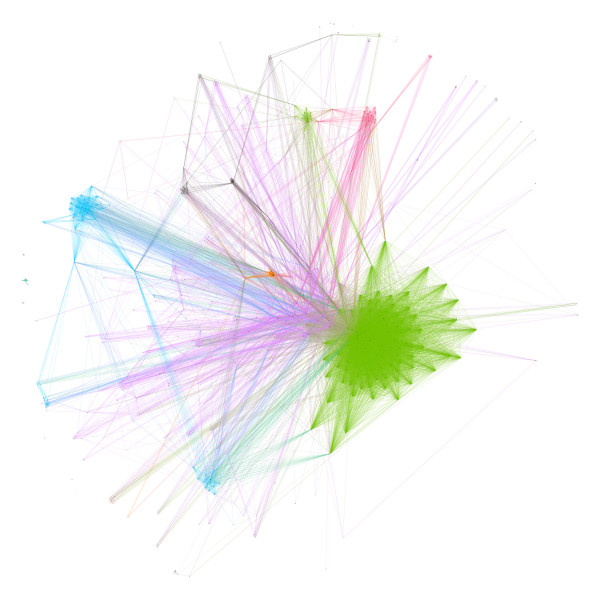
Figure 3.5. A visualization of the network of hashtags connected to other hashtags by virtue of appearing in the same post in our TikTok scrape, colored by modularity (communities of similar interlinkages). The visualization is not particularly useful, other than to demonstrate that clusters of hashtags do differentiate structurally in their use. Originally published in Graham, Huffer, and Simons 2022, figure 2, CC-BY 4.0.
-
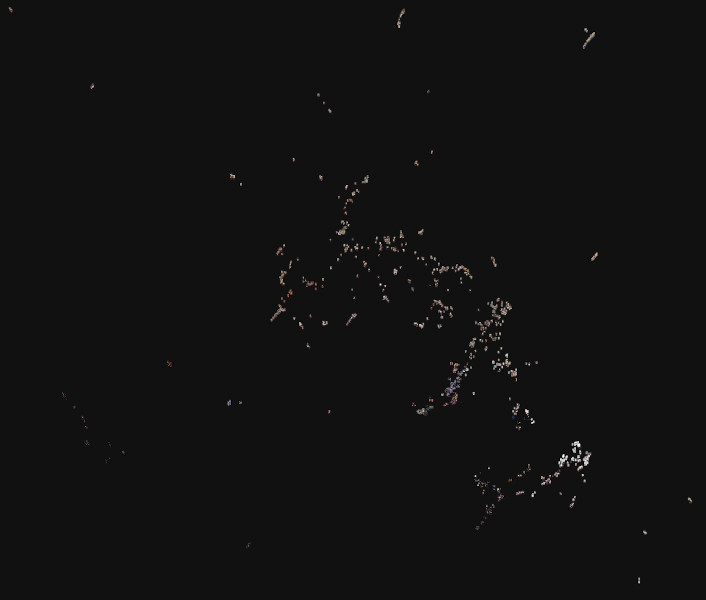
Figure 3.6. The visual similarity of keyframes from the videos rendered into a webgl visualization using t-SNE to organize the images in three dimensions. Originally published in Graham, Huffer, and Simons 2022, figure 7, CC-BY 4.0.
-
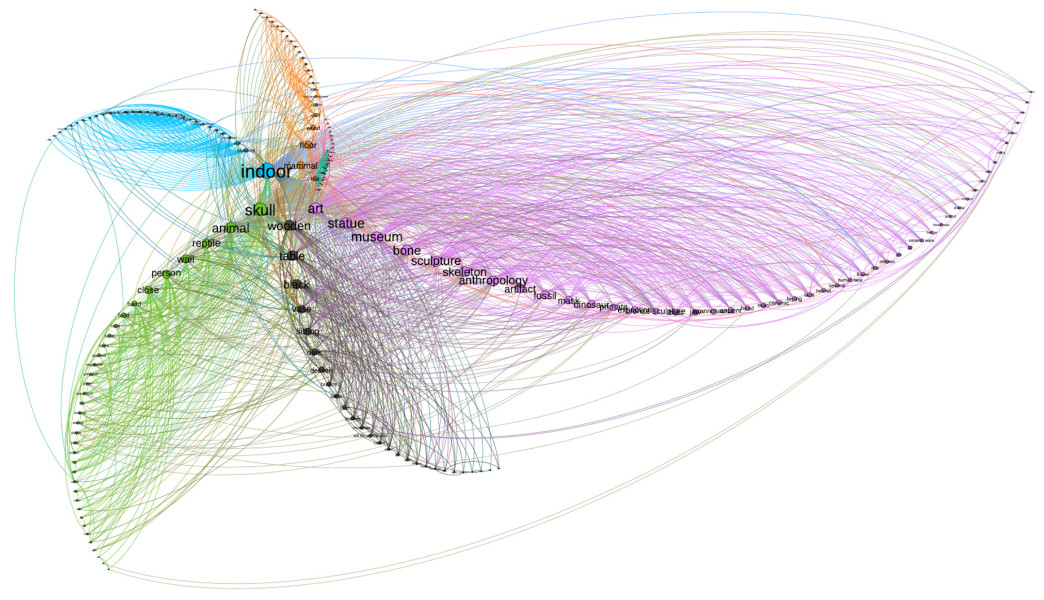
Figure 3.7. An example of the method, depicting a visualization of the major tags assigned to Vendor C’s photographs. Nodes represent tags, edges represent photographs. Radial axes lay out where each spar is a subcommunity; subcommunities are also indicated by color. The size of the node indicates relative importance. The unconnected component is not depicted. The layout obscures some of the smaller subcommunities. Originally published in Graham, Huffer, and Blackadar 2020, figure 3, CC-BY 4.0.
-
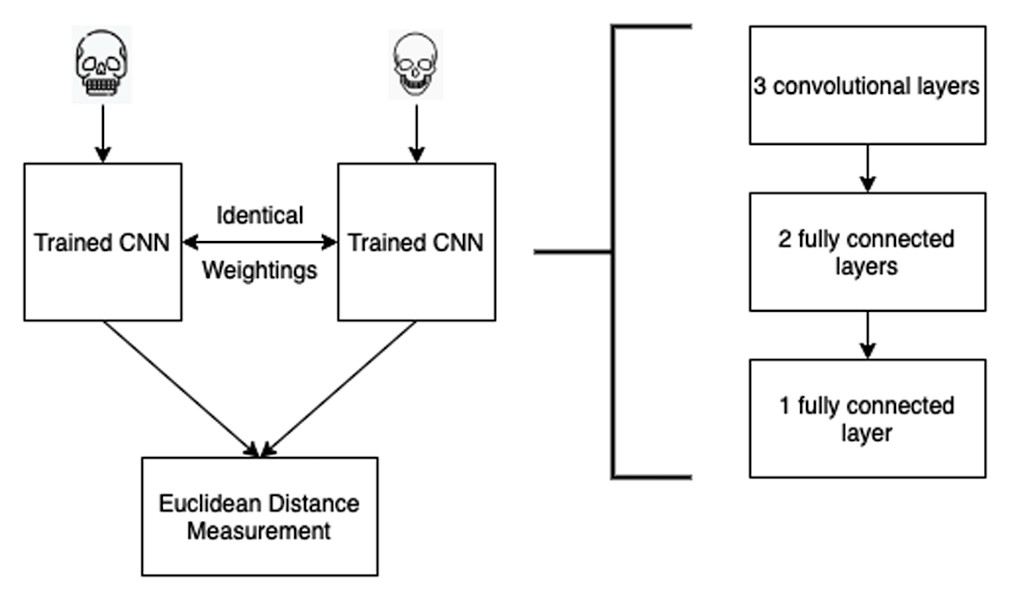
Figure 4.1. A schematic representation of the one-shot learning architecture, where two networks are used at once and a pair of images are evaluated. In practice, a single network where the images are evaluated in turn achieves the same effect at a great savings in memory. Skull icons by user “freepik” on flaticons.com, and user Jake Dunham, thenounproject.com. Originally published in Graham et al. 2020, figure 2, CC-BY 4.0.
-
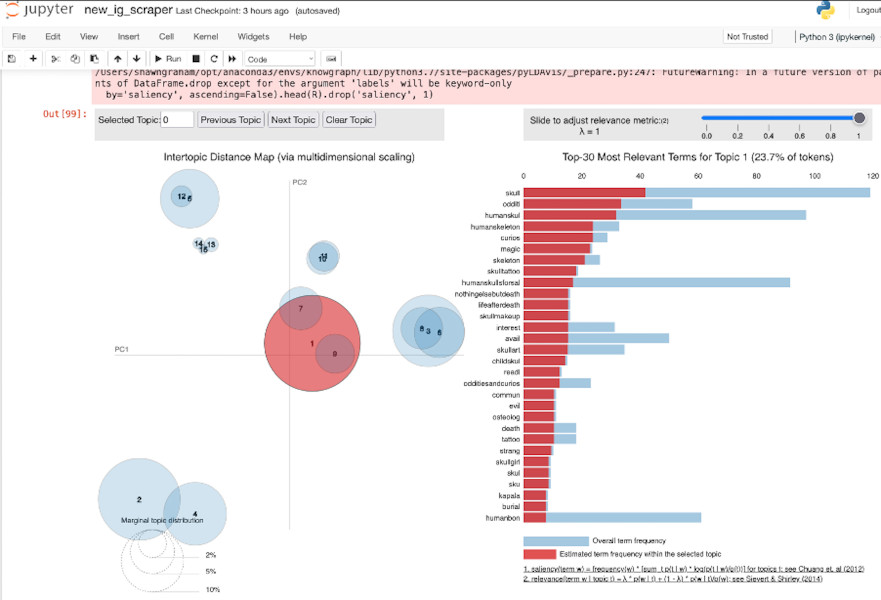
Figure A.1. A screenshot of the visualization of topic model distances using pyLDAvis. CC-BY 4.0.
Email Newsletters
Sign up for our email newsletters to get customized updates on new Berghahn publications.
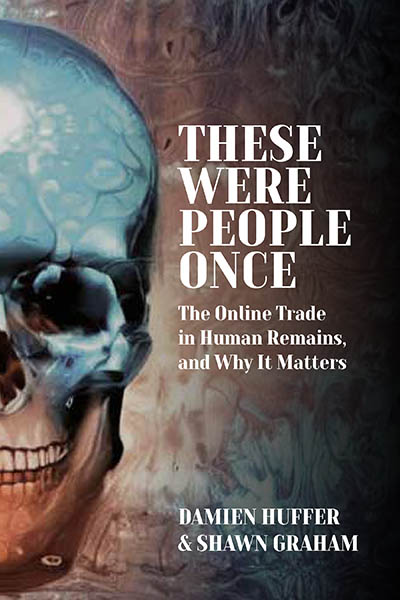
These Were People Once
The Online Trade in Human Remains and Why It Matters
Damien Huffer and Shawn Graham
236 pages, 20 illus., bibliog., index
ISBN 978-1-80539-086-2 $135.00/£104.00 / Hb / Published (September 2023)
eISBN 978-1-80539-363-4 eBook
Reviews
“An easy read on a difficult subject, its beautiful encapsulations of the tragic lives behind their commodified remains highlight the urgency of the authors’ project and public and commercial responses to it. The grim thread of mistreatment of the dead guides the reader through the labyrinth of Big Tech, how cynical tech companies and equally-cynical users are complicit in each other’s harms.” • Samuel Andrew Hardy, Cultural Property Criminologist
Description
People buy and sell human remains online. Most of this trade these days is over social media. In a study of this ‘bone trade’, how it works, and why it matters, the authors review and use a variety of methods drawn from the digital humanities to analyze the sheer volume of social media posts in search of answers to questions regarding this online bone trade. The answers speak to how the 21st century understands and constructs ‘heritage’ more generally: each person their own expert, yet seeking community and validation, and like the major encyclopedic museums, built on a kind of digital neocolonialist othering of the dead.
Damien Huffer is a research fellow with the Wildlife Crime Research Hub, School of Biological Sciences, University of Adelaide. An osteoarchaeologist and interdisciplinary illicit trafficking researcher, he was previously a lecturer in criminology, School of Social Science, University of Queensland, Brisbane. He has also lectured on topics in osteoarchaeology, paleoanthropology and forensic anthropology, most recently for the University of New England, Armidale, NSW. His current research investigates how and why heritage crime and wildlife crime overlap on and offline. He is one of the cofounders of the Alliance to Counter Crime Online.
Shawn Graham is a digital archaeologist. He is Professor of Digital Humanities in the Department of History at Carleton University, Ottawa, Ontario. He is also a cofounder of the Alliance to Counter Crime Online.
Subject: ArchaeologyHeritage StudiesPolitical and Economic Anthropology
Contents
Download ToC (PDF)


